
Introducing Overview

Our Overview feature shows the background information of transaction volume and history, the number of holders based on a token’s price and tokscore.
You can click the Overview item in the toolbar or get started by entering the name of the token you want to track in the search bar right on top of the screen.
All information you can track about a token includes: chart, contract, name, social media, … and other metrics: trading volume, market cap, holders, price….
You can add tokens to your watch list by clicking Follow in the right corner. To view all the tokens you’ve followed, go to Trending Soon and find Following.
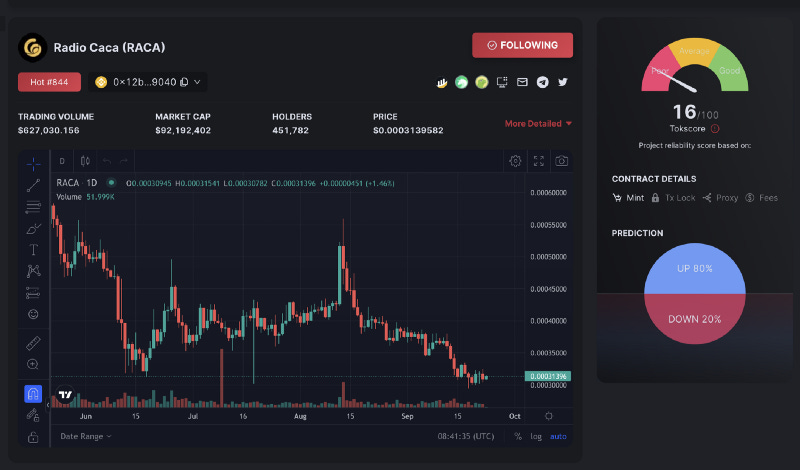
In Overview, we also offer an explicit feature called TokScore which stands for score of the token. On the right side of the screen, you can check the TokScore of a token to partially anticipate the probability of uptrend or downtrend, thereby making the right investment decisions.
Tokscore evaluates the potential of a token based on percentage increase in volume, price change, number of holders, etc,. We collect clean and reliable data to make predictions about the growth potential of tokens, based on the market weight and the formula that has been worked out in meticulous detail.
Volume (Real): 30%
Source: 30%
Price change: 20%
Holder: 15%
Social: 5%
Based on these metrics, TokFlow analysts will make predictions about the potential of this token in the near future, helping investors make the most accurate investment decisions.
You can also share your predictions with Tokflow by voting on the potential of that token in the Prediction section.
Scrolling down, you can view the following information:
Trade History: historical trading data of a token
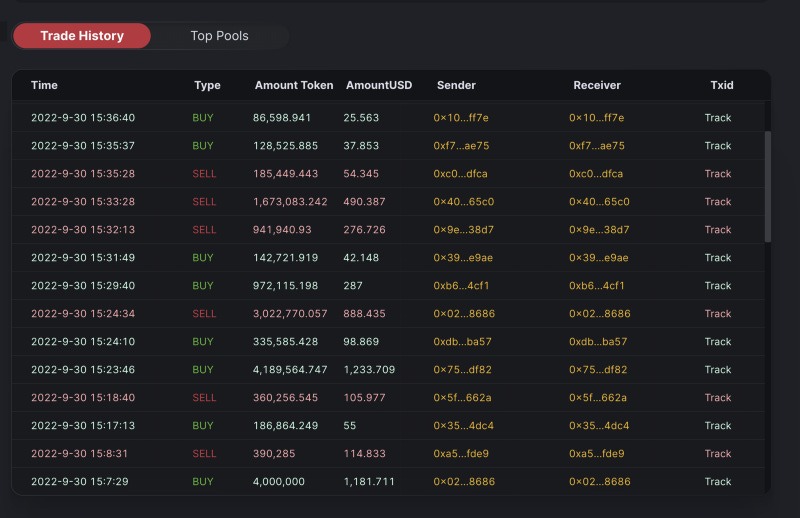
You can track buying/selling transactions of a token based on the following metrics:
Actual time
The amount and value (in USB) of tokens bought/sold
Wallets that transfer (sender) and receive (receiver)
Check transaction details on bscscan.com
2. Top pools: pools of a token
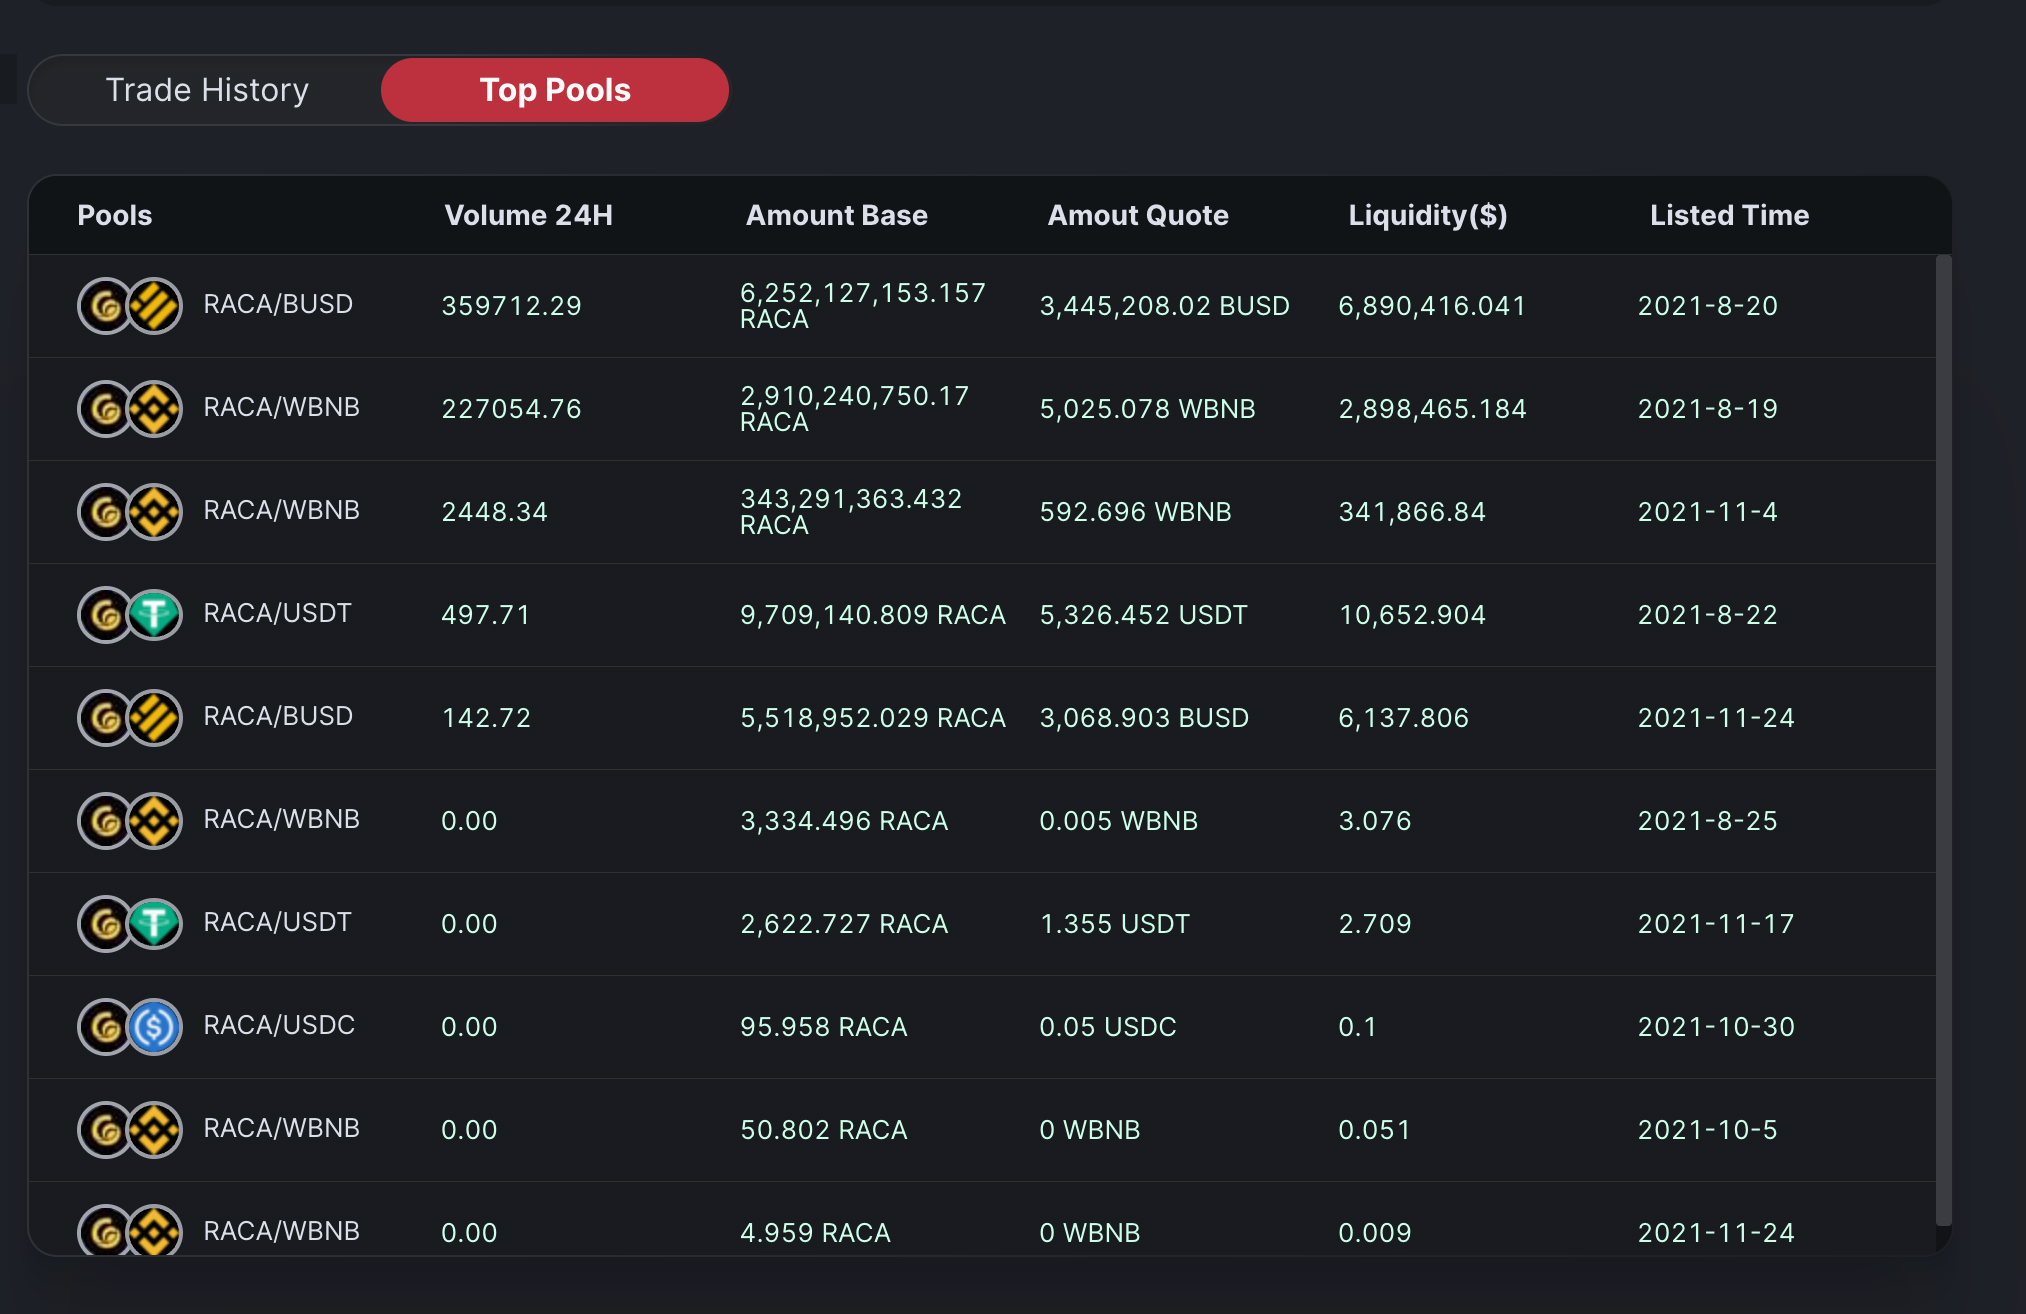
You can check pools of a token you follow based on the following metrics:
Volume 24h in USD
Amount base: total amount of tokens you follow
Amount Quote: the amount of tokens converted in the pool
Liquidity: the liquidity value of the pool in USD
Listed time: starting time of being listed on exchanges and adding liquidity
3. Related: Further down you can see the related tokens in the same category.
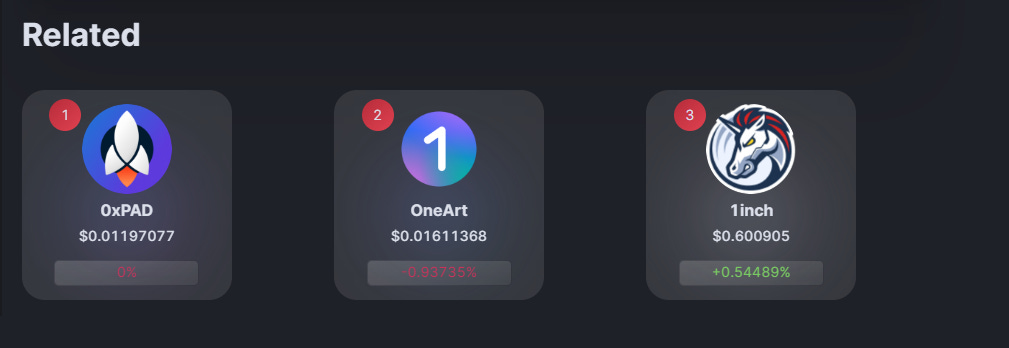
Clicking on a token in this list to go to the linked dashboard to see the overview of that token. This feature helps you analyze a list of tokens in the same ecosystem to identify whether they follow the same trend (bullish or bearish) or not, thereby evaluating the prominence of the whole ecosystem.