


Introducing Profit/Loss Average

Our Profit/Loss Average feature allows you to analyze the total profit and loss of each wallet cluster over time.
You can get access to it via the home screen and right clicking the Profit/Loss Average item in the toolbar. Then, enter the token you want to track in the search bar on top of the screen.
Please note that to make use of the Profit/Loss Average functionality, you have to be subscribed as a TokFlow Standard user.
Now let’s take a high level look at what this feature covers.
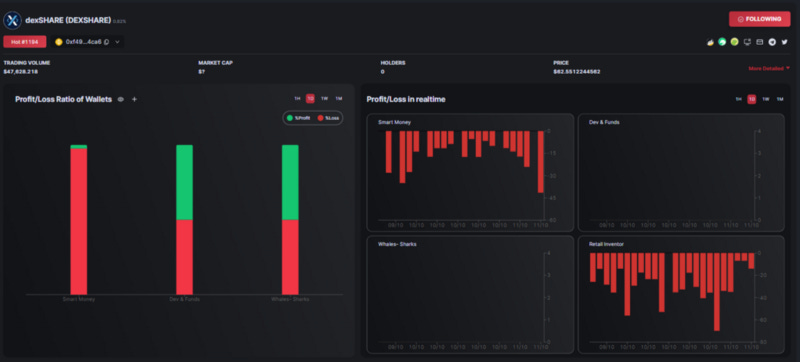
Profit/Loss Ratio of Wallets: shows the profit/loss ratio of each cluster of wallets in the last 1 hour, the last 1 day, the last 1 week and the last 1 month.
Smart Money
Dev & Funds
Whales-Sharks
Profit/Loss Ratio in real time: the cluster of charts shows the profit/loss ratio of each cluster of wallets holding a token compared to the current price of that token over time. You can view the hourly candle, daily candle, weekly candle and monthly candle.
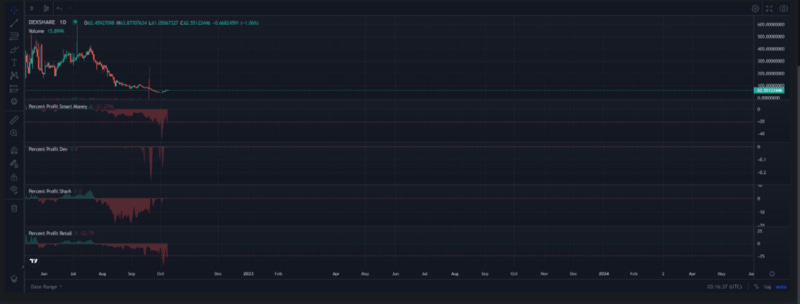
The last one is the chart shows in detail at each price range, how much percentage of profit/loss of the Smart Money, Dev & Funds, Whales-Sharks, Retail Investors wallet clusters compared to the actual price at that time.
At the end of the day, the Profit/Loss Average feature makes you fully aware of the profits and losses of different crypto assets and spot the high-profit dominance which can be a sign of shifting sentiment, thereby evaluating trading performance and working out your best trading strategy.